Female Xolopreneurs: You're charging 50% less than your male counterparts
.jpg)
on March 31, 2022 • 2 minute read

Last year during International Women's Month, we learned that only 15% of Xolo customers are women. This year, it was only natural that we wrap up Women's Month 2022 by giving you an update on any and all progress we've made.
So we asked one of our resident data gurus to dive into the numbers and retrieve some answers. In addition to the current gender divide of existing Xolopreneurs, we wanted to find out if there were any other notable patterns in user data when broken down by gender. Namely:
- Is there a significant difference in the amount male and female Xolopreneurs are charging for comparable jobs
- Any significant difference in monthly income
- Lifetime of the business/growth trends when broken down by gender
- Amount and/or variety of clients
Here's what we found out….
The amount of female Xolopreneurs increased by 1.68% YoY
In the interest of statistical transparency, we should mention that choosing to disclose gender on our platform is optional. But in the equally important interest of keeping this analysis relatively uncomplicated, we chose to focus our attention on Xolopreneurs who chose to identify as either male or female.
The good news is that the amount of female Xolopreneurs has grown by a modest but respectable 1.68% since March 2021. Here's how the gender divide breaks down across Xolo products.
.png?width=1280&name=Xolo_ES_Blog_Content_WomensMonth_Data_Slide_1%20(1).png) Xolo Spain takes the lead for highest percentage of female-owned businesses
Xolo Spain takes the lead for highest percentage of female-owned businesses
Gender doesn't affect amount of clients, lifetime of company, or time spent in self-service
Let's start with median lifetime of company by gender. Since our Go product doesn't have a termination date and our local products in Spain and Italy haven't yet hit a statistically significant volume of users, we chose to focus on the average lifetime of Leap companies. The median lifetime of a Leap company from formation to termination is currently neck and neck at 27 months for both genders.
.png?width=1280&name=Xolo_ES_Blog_Content_WomensMonth_Data_Slide_5%20(1).png) The median lifetime for a Leap company is 27 months for both genders
The median lifetime for a Leap company is 27 months for both genders
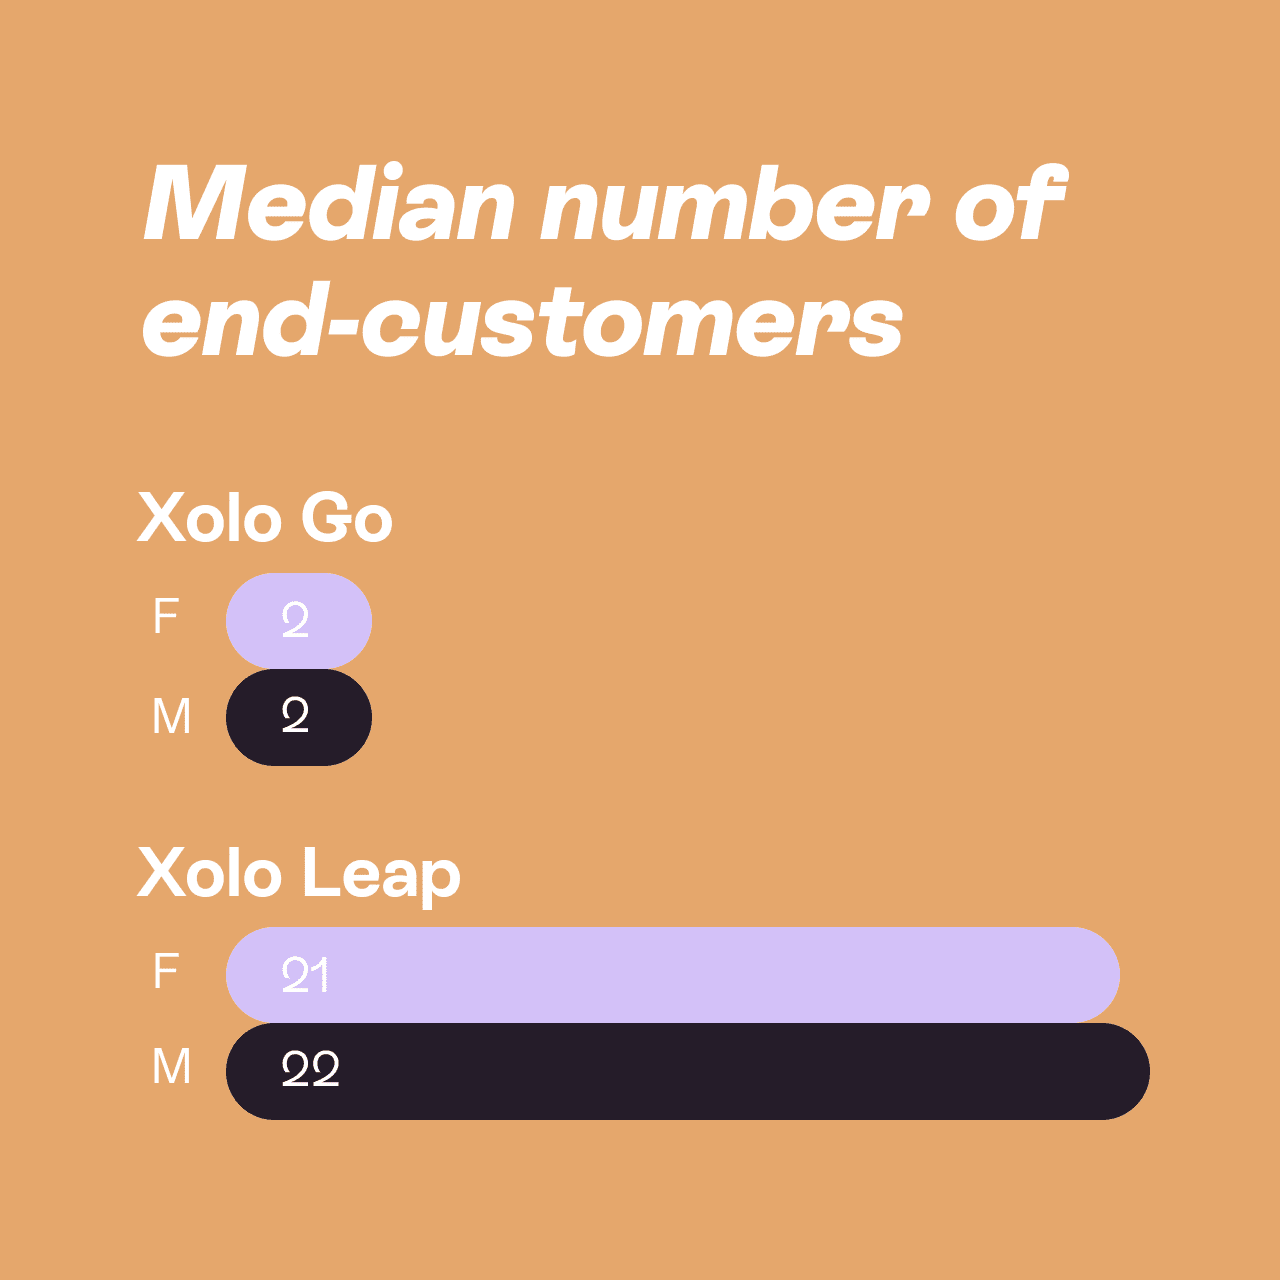
For median amount of end customers, the numbers remained surprisingly consistent for both Leap and Go. While male Leap users had a median of 22 clients to female Leap users' 21 clients, both female and male Go users have a median of two clients.

And even for the time spent onboarding and operating a Xolo business, measured as the median time spent in Xolo's self-service dashboard every month, the numbers were strikingly consistent when broken down by gender:
.png?width=1280&name=Xolo_ES_Blog_Content_WomensMonth_Data_Slide_4%20(1).png) Males and females spend the same amount of time managing their Xolo business each month via the self-service dashboard
Males and females spend the same amount of time managing their Xolo business each month via the self-service dashboard
The TL;DR? There's no significant difference between male and female companies when it comes to the amount of clients, the lifetime of a company, or the amount of time spent running it.
Female Xolopreneurs are billing 50% less than their male counterparts
We've finally reached the shocking — but sadly, not altogether surprising— part of our gender analysis. But the numbers don't lie. And we found that female Xolopreneurs are billing 50% less than Xoloprener's companies every month.
.png?width=1280&name=Xolo_ES_Blog_Content_WomensMonth_Data_Slide_2%20(1).png) Note: If there was no income in the given month, the company was not added to the median calculation
Note: If there was no income in the given month, the company was not added to the median calculation
Broken down by Xolo's top four most popular business categories, Design and Creative was the only category where women are billing more than their male counterparts..png?width=1280&name=Xolo_ES_Blog_Content_WomensMonth_Data_Slide_3%20(1).png)
In general, we don't like to tell anyone how they should run their business. But in this case, the data suggests that if you're a female Xolopreneur reading this blog post right now — you might want to consider raising your rates. 😉
